
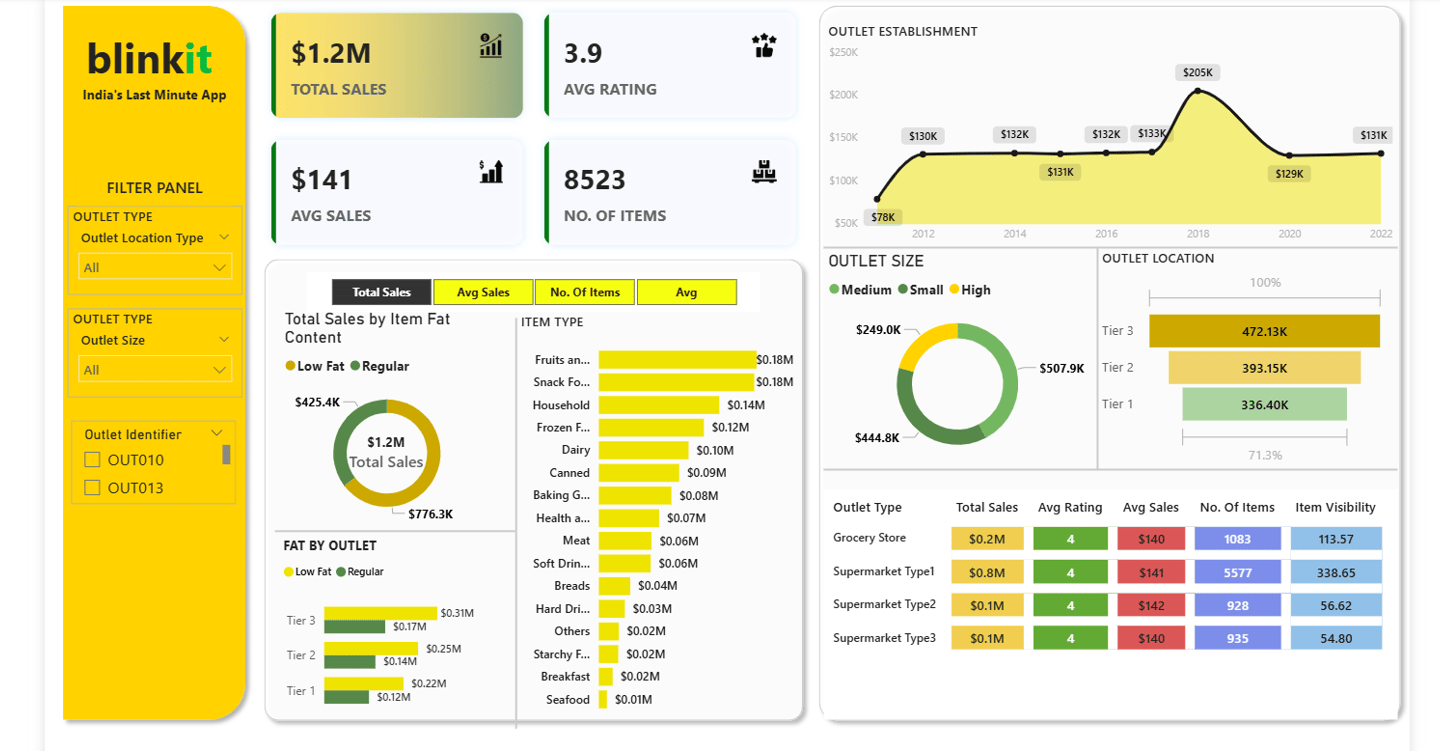
blinkit Dashboard
The Blinkit Dashboard, built using Power BI, provides a comprehensive overview of sales, orders, customer trends, and operational performance. It consolidates key metrics such as total sales, average order value, delivery time, and customer acquisition to offer actionable insights for business growth. The dashboard is designed with interactive visuals, filters, and drill-through features that enable users to analyze data across multiple dimensions like location, category, and time period. By transforming raw Blinkit data into meaningful insights, this dashboard helps decision-makers monitor performance, identify growth opportunities, and optimize operations. With its user-friendly interface, real-time analytics, and visually appealing design, the Blinkit Dashboard is a powerful tool for tracking business KPIs, improving efficiency, and supporting data-driven decision-making.
Business Report — Reliance Industries
Prepared by Gleanfane Technology · 2025-08-22
This project presents a Business Report on Reliance Industries, prepared on August 22, 2025 by Gleanfane Technology. The report analyzes key financial trends and performance indicators of Reliance Industries (RELIANCE.NS).
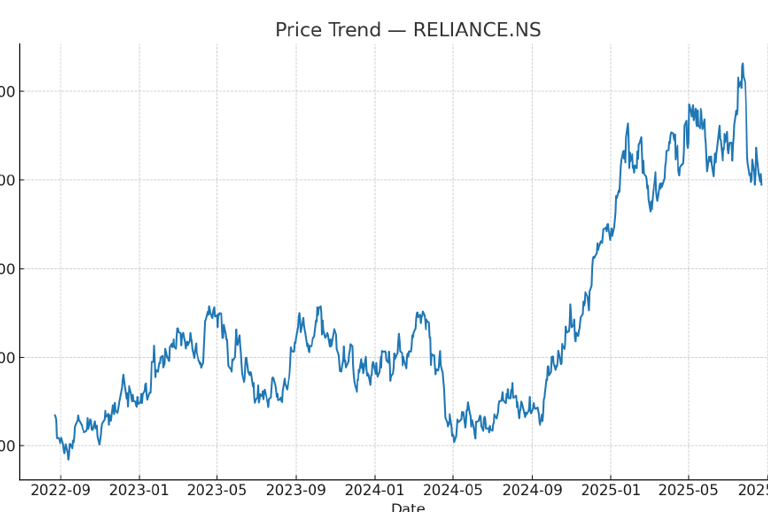
Price Trend Analysis: The left chart illustrates the stock price movements of Reliance Industries over the period from 2022 to 2025, showing phases of volatility with significant upward momentum in early 2025.
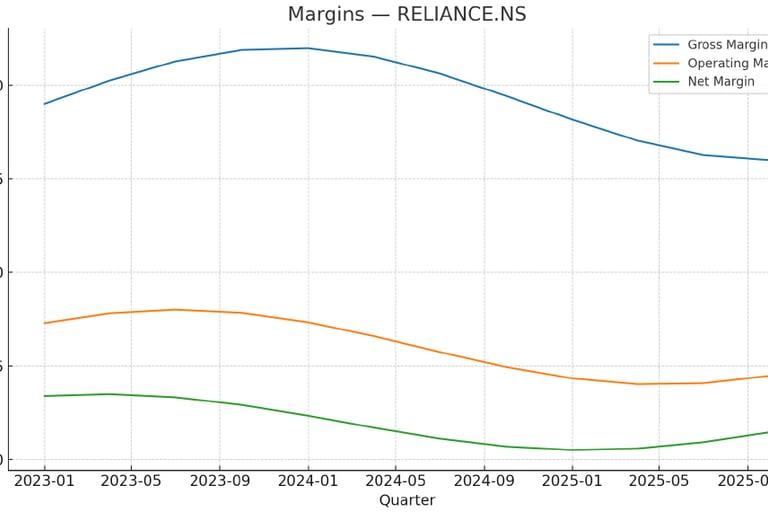
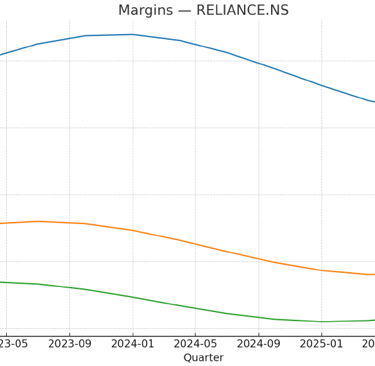
Margins Analysis: The right chart tracks Gross Margin, Operating Margin, and Net Margin across quarterly data from 2023 to 2025. While margins initially rose, they displayed a downward trend from mid-2024, indicating possible cost pressures or declining profitability.